Compare your data to national counts using ListBuilder:
This guide is step 2 in our Example Walkthrough: compare demographic counts of their data with the national voter file with ListBuilder.
We’ll use the ListBuilder API to query national counts for different demographic data. Then we’ll compare that data with the counts we received from the SmartMatch API in Step 1.
Make sure to review api_docs_reference.ipynb to interactively test out the code.
Getting started
- Start with a code editor.
- Know the names of the fields for demograhpics you’ll want to get national counts for (
tsp.age_range,vb.voterbase_gender, etc.)
Let’s get to the code!
Step 1: Get National Counts
We’ll use the function listbuilder_count below to query the ListBuilder API.
import os
import requests

def listbuilder_count(where_clause):
    """
    Queries the ListBuilder API and returns the count of available records matching the where_clause

    :param where_clause: valid SQL where clause
    :type where_clause: string
    :returns: a integer count of records matching the where clause
    """

    api_key = os.environ["TS_API_KEY"]

    endpoint = "https://api.targetsmart.com/person/listbuilder"
    params = {
        "mode": "count",
        "where": where_clause,
    }
    headers = {"x-api-key": api_key}

    response = requests.get(endpoint, params=params, headers=headers)
    response.raise_for_status()
    return response.json()["count"]
To query the counts for specific demographic fields in listbuilder_count, use the get_national_counts function below to make the where_clause.
def get_national_counts(field_name, field_values):
    """
    Gets National counts for a field using ListBuilder API.

    :param field_name: The demographic field name you want to get counts for (e.g. vb.voterbase_registration_status')
    :param field_values: A list of values for that field (e.g. ['Registered', 'Unregistered'])
    :returns field_counts: Dictionary of field values and their counts.
    """
    field_counts = {}
    for value in field_values:
        where_clause = f"{field_name}='{value}'"
        count = listbuilder_count(where_clause)

        field_counts[value] = count
    return field_counts
Let’s use the functions above to get some national counts!
field_name = "vb.voterbase_registration_status"
values = ['Registered', 'Unregistered']
national_counts = get_national_counts(field_name, values)
print(national_counts)
You can replace the field_name and values variables with the any demographic and value list and you’ll be able to get the national counts for that demograhpic.
This is printed when we run our program:
>> {'Registered': 219044684, 'Unregistered': 42648515}
Step 2: Get Counts for WAG’s File
First, we’ll use Pandas to create a DataFrame representation of the SmartMatch enhanced file from Part 1.
import pandas as pd

df = pd.read_csv('<file_path>.csv', sep=',')
Then we’ll use the get_file_counts function below to get counts for a field from the dataframe.
def get_file_counts(df, field_name):
    """
      Given a dataframe and a field, return counts for all the values in that field.

      :param df: Dataframe representation of your list
      :param field_name: Voterbase field to get counts for
      :return: dictionary of field values and their counts
    """
    return df[field_name].value_counts().to_dict()
While get_national_counts will return a dictionary of national field counts, get_file_counts will return a dictionary of field counts just in your file universe.
Step 3: Plot Comparison Graphs and Save to PDF
Below is the code to plot comparison graphs for each field and save them in a PDF.
import matplotlib.pyplot as plt
%matplotlib inline
from matplotlib.backends.backend_pdf import PdfPages
import matplotlib.ticker as mtick
import numpy as np

# Start to create the PDF, WAG_and_National_graphs:
pdf = PdfPages("WAG_and_National_graphs.pdf")

def calculate_percentages(counts):
    """
      Calculates percentage of each field value in the total

      :param counts: dictionary of raw counts for a demographic
      :return: dictionary of percentages of demographic counts
    """
    total = sum(counts.values())
    percentages ={}
    for k,v in counts.items():
        percentages[k] = v/total*100 if total !=0 else 0
    return percentages

def plot_graph(national_counts, wag_counts):
    """
    Plot WAG and National percentages in a bar graph

    :param national_counts: dictionary of National counts for its field value
    :param wag_counts: dictionary of WAG counts for its field value
    """
    national_perc, wag_perc = calculate_percentages(national_counts), calculate_percentages(wag_counts)

    # Saves the keys and values as variables:
    wag_keys, wag_values = wag_perc.keys(), wag_perc.values()
    national_keys, national_values = national_perc.keys(), national_perc.values()

    # Using numpy to group data with bars:
    wag_bar = np.arange(len(wag_keys))
    national_bar = np.arange(len(national_keys))
    ax = plt.subplot(111)

    # Using wag_bar and national_bar to align the bars side by side:
    width = 0.25
    ax_wag = ax.bar(wag_bar - width / 2, wag_values, width)
    ax_nat = ax.bar(national_bar + width / 2, national_values, width)

    # Show the percentages above each bar:
    for p in ax_wag.patches:
        width = p.get_width()
        height = p.get_height()
        x, y = p.get_xy()
        ax.annotate(
            f"{(height/100):.0%}", (x + width / 2, y + height * 1.02), ha="center"
        )
    for p in ax_nat.patches:
        width = p.get_width()
        height = p.get_height()
        x, y = p.get_xy()
        ax.annotate(
            f"{(height/100):.0%}", (x + width / 2, y + height * 1.02), ha="center"
        )
    # Overriding the x axis:
    ax.set_xticks(wag_bar)
    ax.set_xticklabels(labels=wag_keys)

    # Show the legend and y ticks as percents:
    ax.legend(("WAG", "National"))
    ax.yaxis.set_major_formatter(mtick.PercentFormatter())

    # Saves as PDF:
    pdf.savefig()

    # Show the plots:
    plt.show()


def plot_fields(field_names):
    """
    From a list of field names, get the counts to plot for each field.

    :param field_names: list of field names to plot
    """
    for field in field_names:
        field_values = df[field].dropna().unique()
        national_counts = get_national_counts(field, field_values)
        wag_counts = get_file_counts(field)
        plt.title(field)
        plot_graph(national_counts, wag_counts)
        print("Raw counts for", field, ":")
        print("National File:", national_counts, "\nWAG:", wag_counts)


# The main method to run with example fields:
plot_fields([ 'vb.voterbase_gender',
              'vb.voterbase_registration_status',
              'tsp.age_range',
              'tsp.party_score_rollup',
              'tsp.tsmart_partisan_score_bucket',
              'tsp.tsmart_presidential_general_turnout_score_bucket',
              'vb.voterbase_race',
              'vb.vf_voter_status' ])
pdf.close()
This is what a graph would look like:
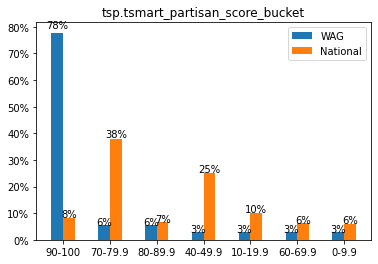
Where to next?
Start from the “Graph demographics for WAG list vs. National File” cell in the Python notebook to see more details on how we compare WAG’s list with the national voter file side by side. Go ahead and duplicate the notebook to play with it yourself!