ListBuilder Explore
To get started, log into your MyTargetSmart account and click on ListBuilder.
Explore is the primary ListBuilder interface, providing access to easily query TargetSmart data in a secure browser session. Users are empowered to define query criteria and then view counts, cross-tabs, and visualizations.
Quick Start
Step 1: Fields/Dimensions
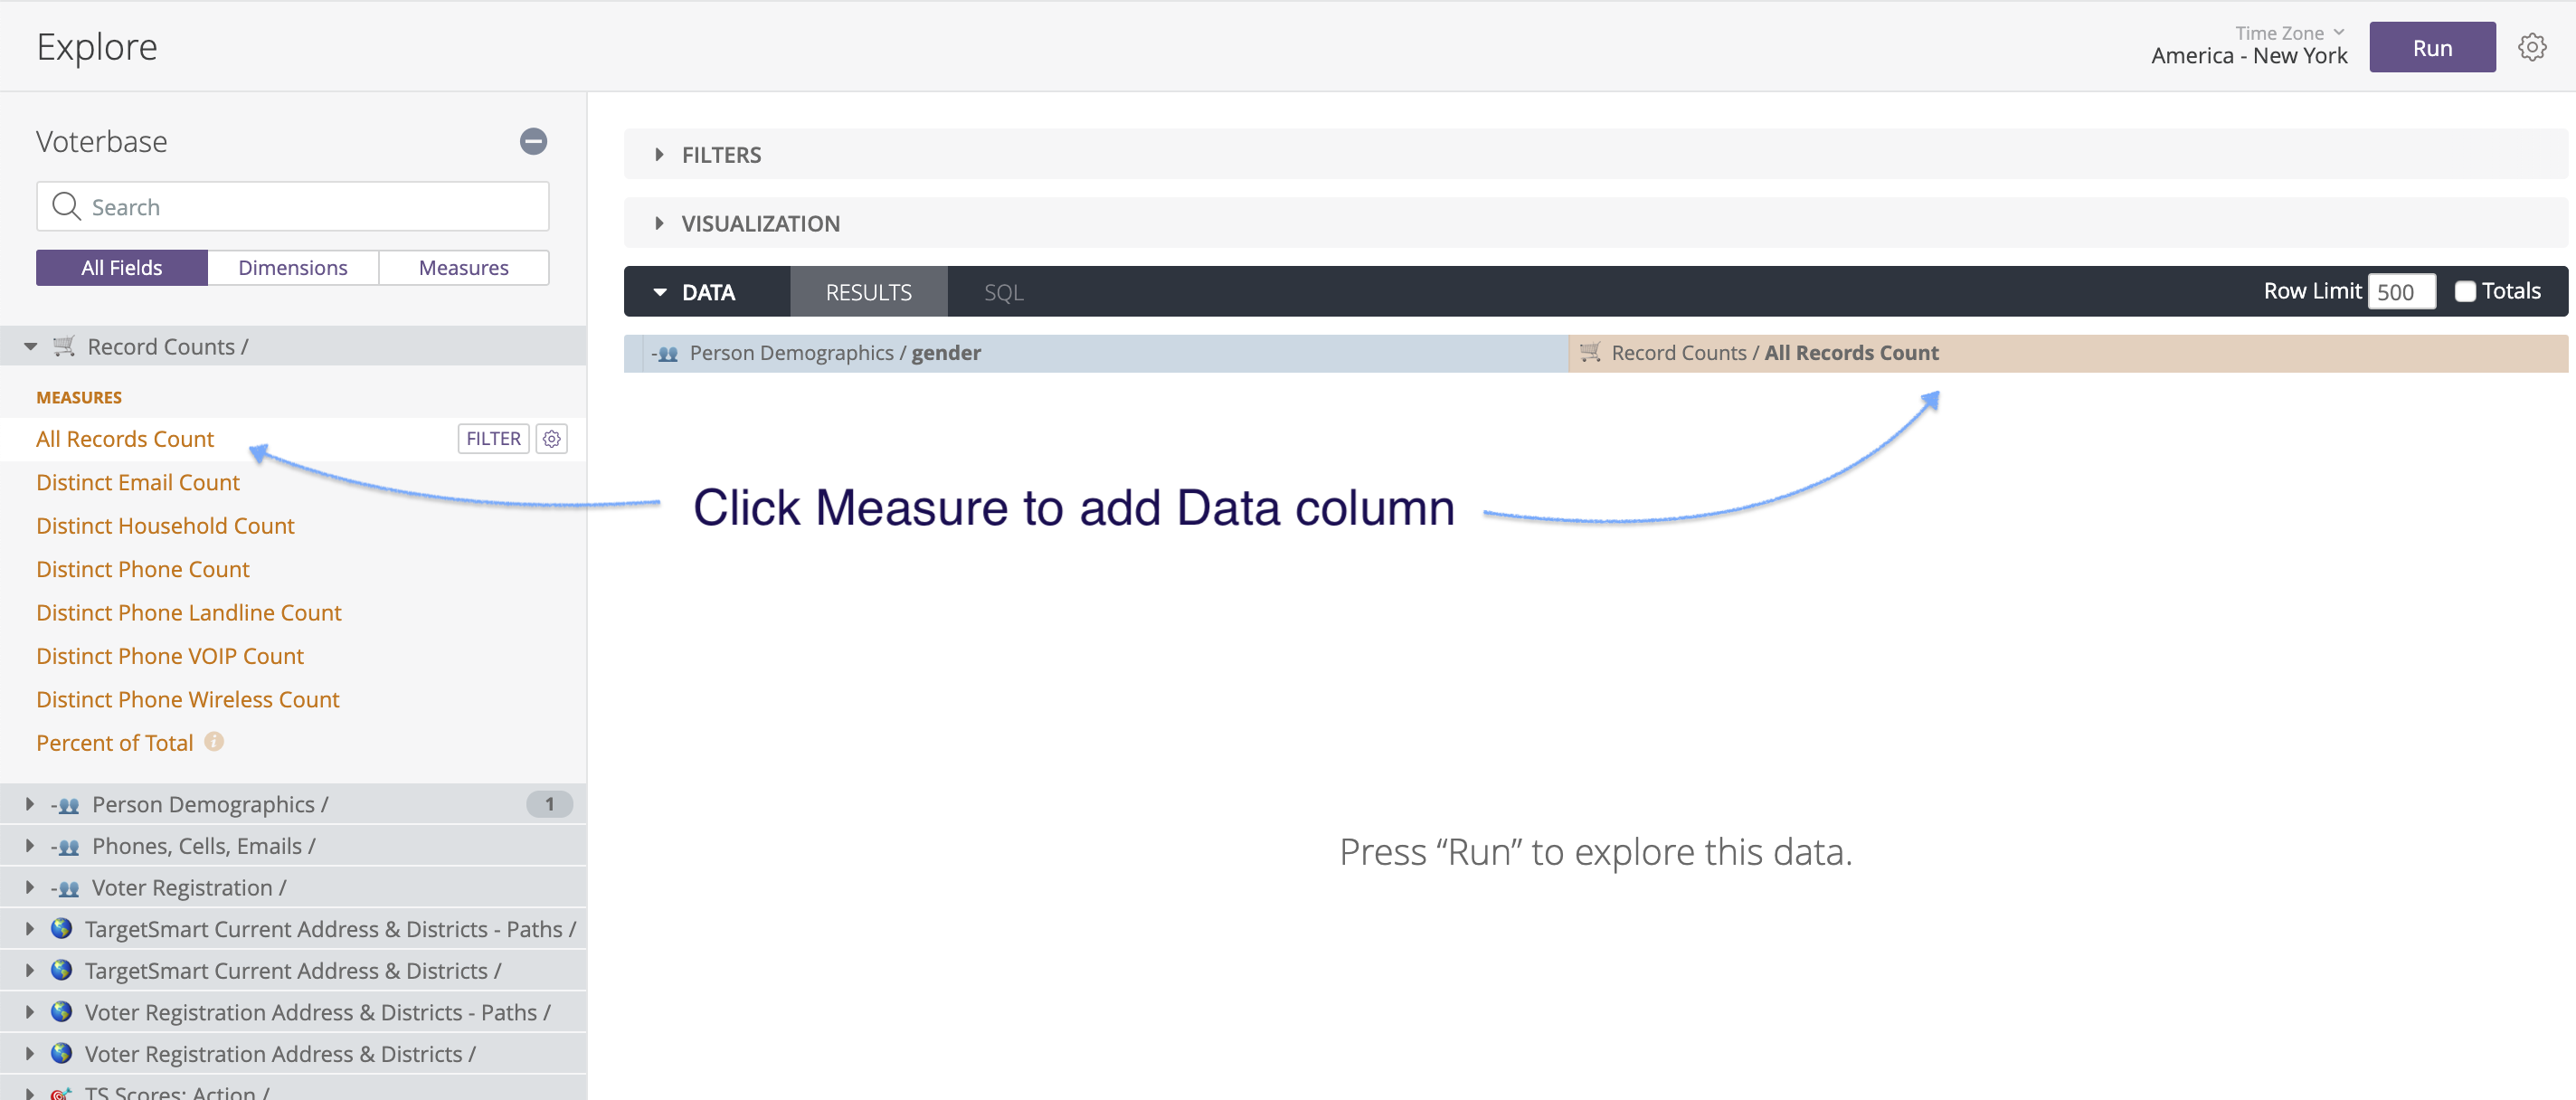
Choose the value(s) you want to query to create your universe. Choose a database field from the grouped sections in the left side bar Field Picker. These fields are known as dimensions in ListBuilder. Clicking on the dimension label, e.g., gender, will bring it into the Data section as a table column.


Step 2: Counts/Measures
Next, select the type of count you want from the top of the menu on the left. These counts are also known as measures in ListBuilder. Click Run in the upper right corner to get a count or go to Step 3.
Step 3: Filtering Data (Optional)
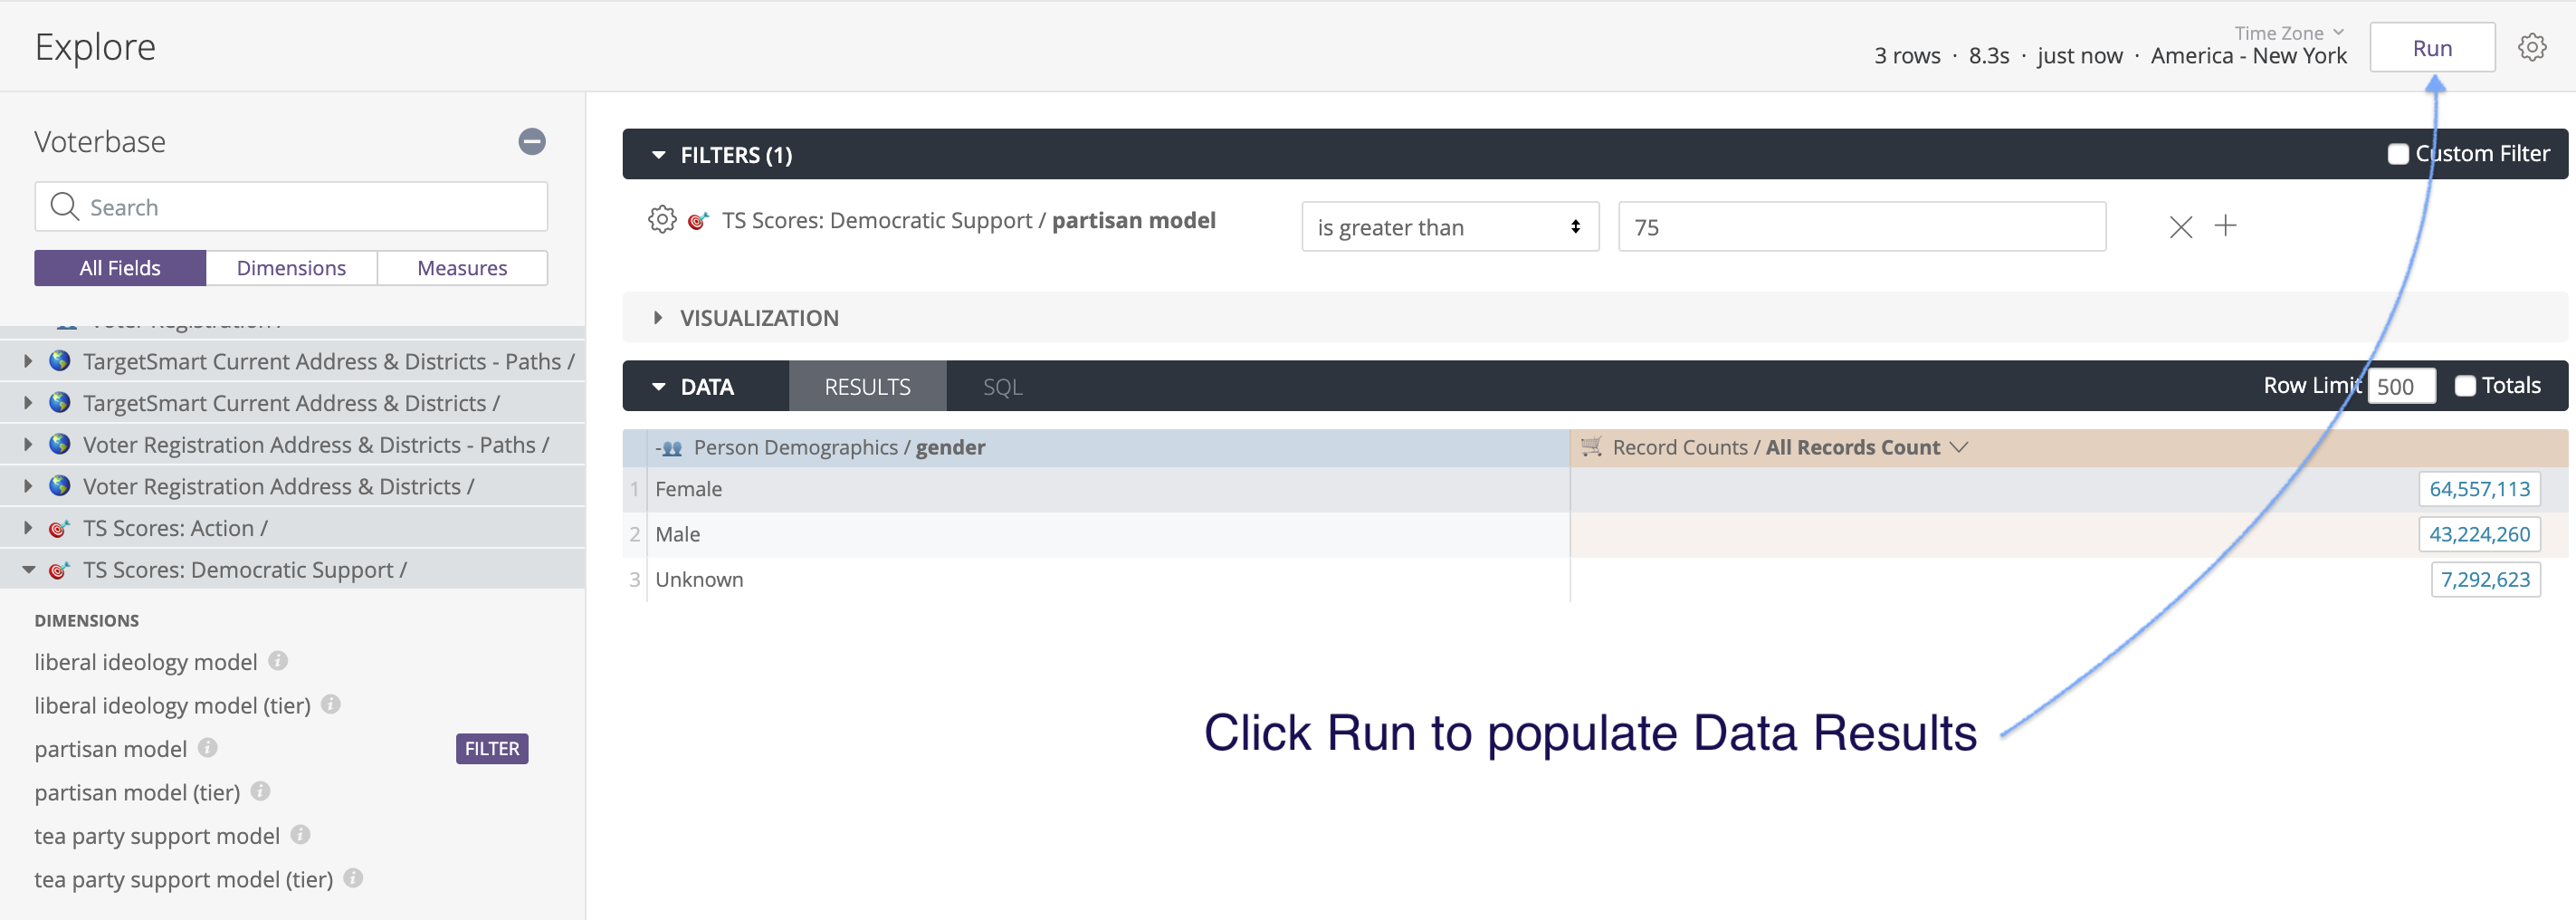
Lastly, select how you want to filter the data, you can do this by hovering your cursor over the dimension and click the Filter button which will appear next to the label. Then, select how you want to apply criteria in the Filter section above the Data and Visualization sections. Once you start typing in the Filter box it will populate with all available values for that field.

Step 4: Viewing and Exporting a Count
After you have selected your fields and filtered down to your desired universe you can run counts. Click Run in the upper right corner to get a count on your selected universe. After you run the counts, you can change the way they are displayed in the Visualization section.
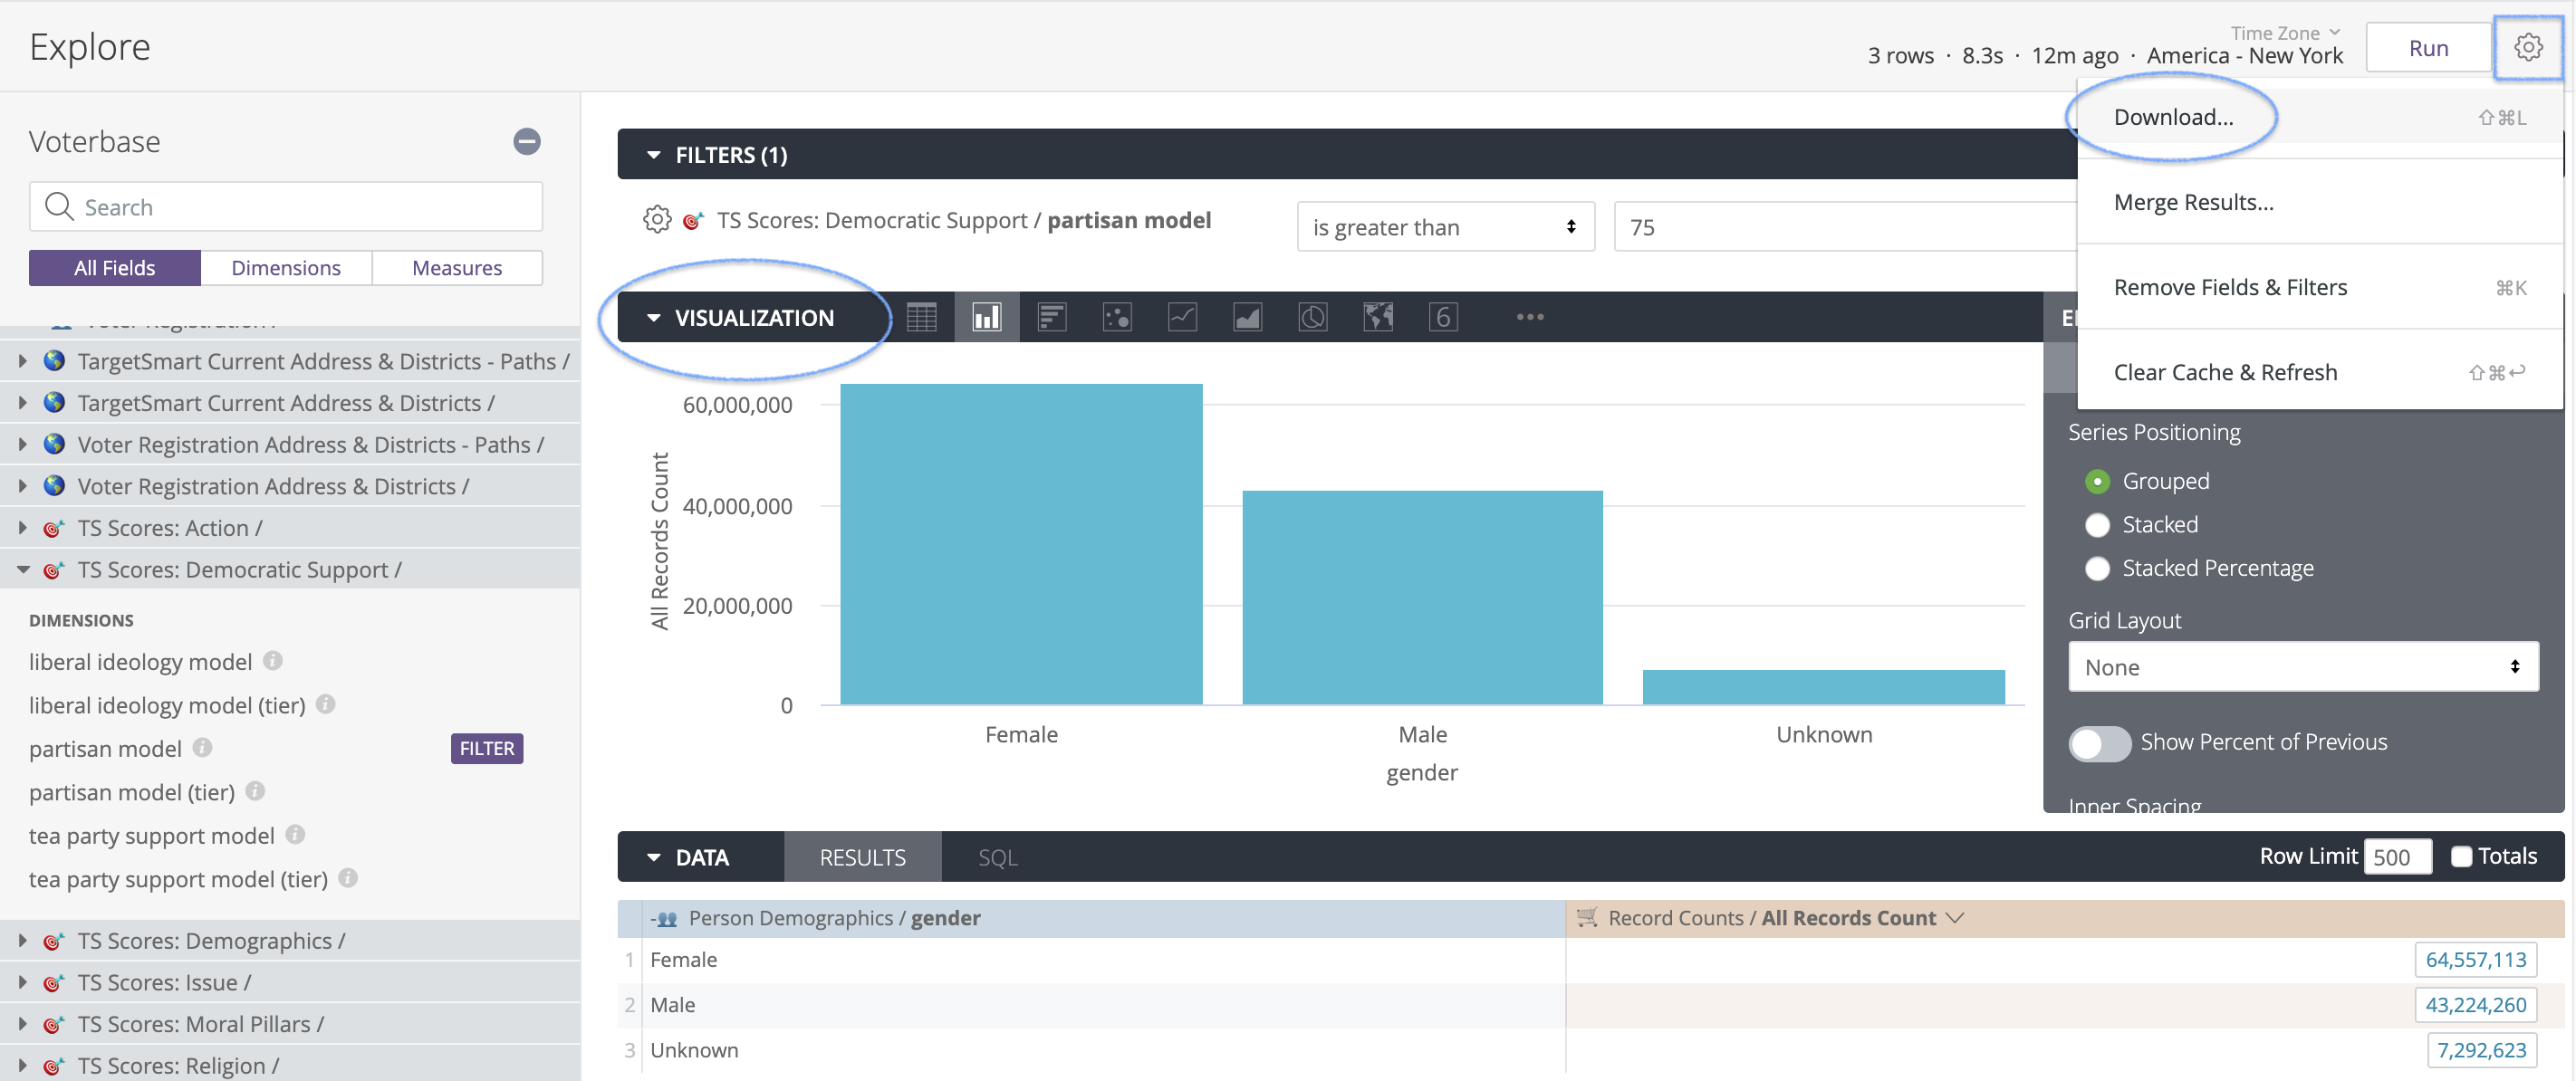
After running, expand the Visualization section to view different visualizations of your data selection.
If you are satisfied with your counts after you have run them, and you have ensured that your visualization tab shows the data organized in the way you want, you can export counts to a variety of file formats by clicking the “gear” Icon next to Run in the upper right corner, and then clicking Download.
Step 5: Setting up a crosstab
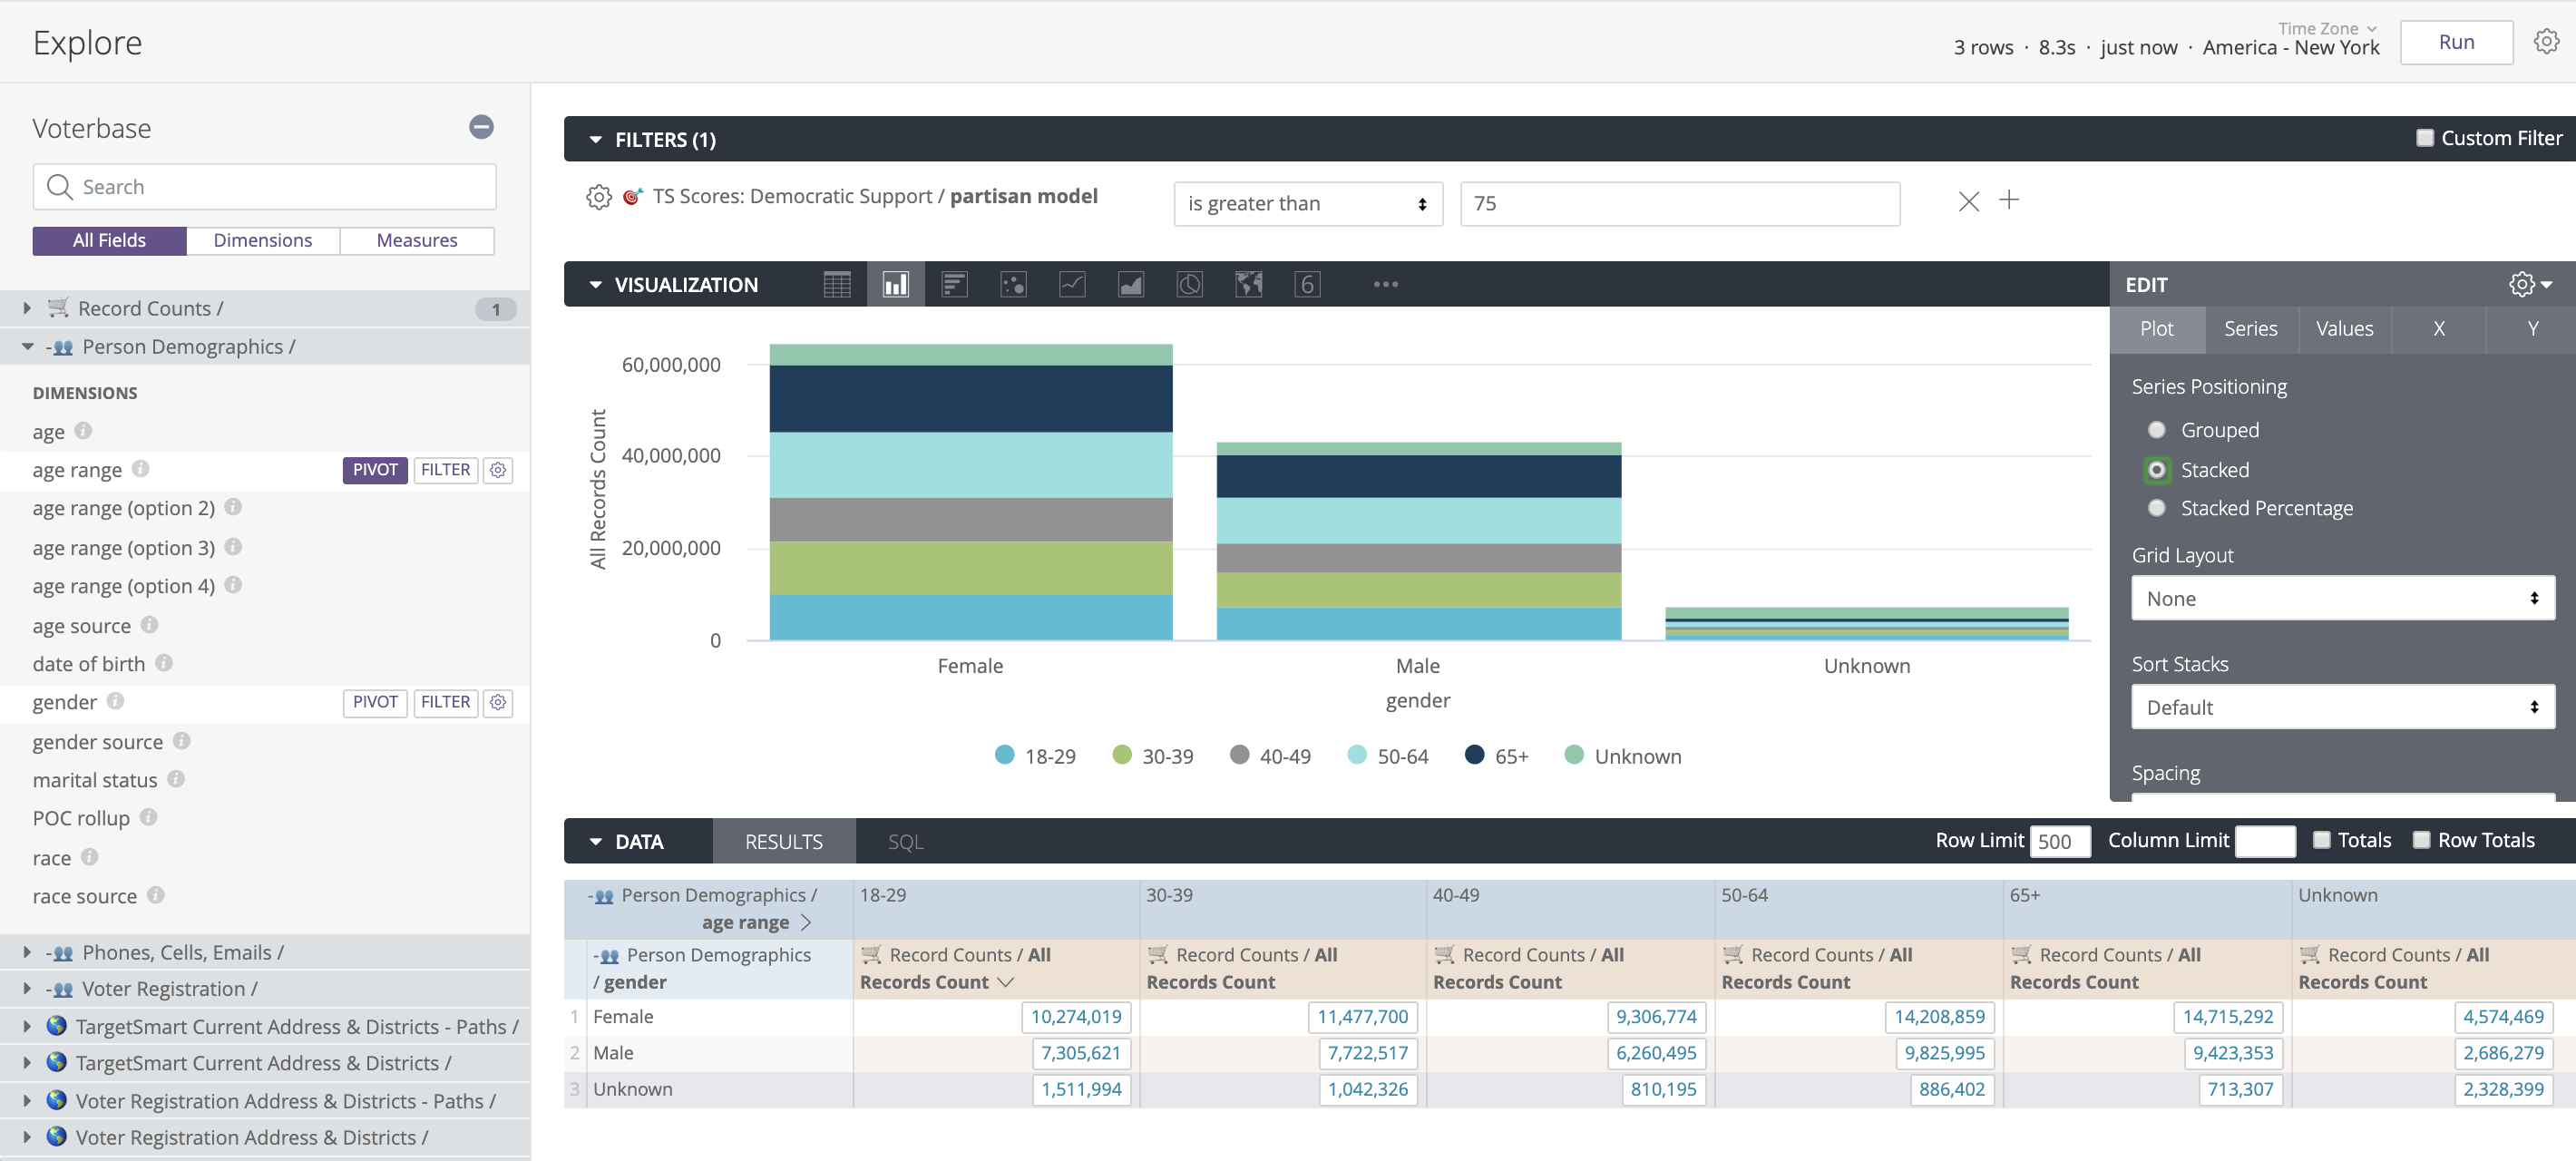
You can also explore a cross-tab by hovering over a dimension name and selecting the Pivot button beside its label. This will allow you to view breakdowns of how the data is spread out over various criteria. You can only pivot on dimensions, not counts measures. Click Run again to view your cross-tabs.
Explore In-Depth
At its core Explore is a tool for generating queries that are understood by the TargetSmart ListBuilder database.
You do not need to know or need to learn SQL in order to use ListBuilder. However, If you are familiar with SQL, you may find these relations between the Explore interface and its generated SQL useful:
- Dimensions
- included in the SELECT clause and GROUP BY clause
- Measures
- included in the SELECT clause using aggregate functions
- Filtering on Dimensions
- included in the WHERE clause
- Filtering on Measures
- included in the HAVING clause
- Pivots
- not an important part of the SQL query, only changes how the results are displayed.
The data shown in Explore is determined by the dimensions and measures you select from the Field Picker at the left. A dimension can be thought of as a group or bucket of data. A measure is information about that bucket of data. Dimensions appear as blue columns and measures appear as orange columns in your data table.
Understanding Dimensions
A dimension is what you want information about, e.g., voter age range. ListBuilder Explore displays dimensions in grouped sections on the Field Picker. Examples:
- Voter Registration / registration status
- Person Demographics / age range
Clicking on the dimension name will bring it into the Data Explore table as a query result column.
Hovering your mouse over a dimension will display additional options:
- FILTER button: Brings the dimension into the Filters Explore section for further customization to express your criteria
- PIVOT button: Brings the dimension into the Data Explore table but as a cross-tab heading instead of a table row
Choosing a dimension will return all the unique results for that dimension. ListBuilder will then create one row in the result set for each unique record.
When multiple dimensions are chosen, ListBuilder will return the unique combinations of these dimensions, not the unique results of each individually. One way to explain this is that Looker concatenates the dimension columns selected and groups by the new unique concatenated phrases.
Understanding Measures
If a dimension is what you want to know about, the measure is the “what” you are looking to learn. The measure is the calculation that the tool is running in order to generate a count for you. ListBuilder supports these measures:
- All records count: The number of database records found for the given criteria
- Distinct email count: The number of distinct email addresses found for the given criteria
- Distinct household count: The number of distinct households found for the given criteria
- Distinct phone count: The number of distinct phone numbers found for the given criteria
- Distinct phone landline count: The number of distinct landline phone numbers found for the given criteria
- Distinct phone VoIP count: The number of distinct VOIP phone numbers found for the given criteria
- Distinct phone wireless count: The number of distinct wireless phone numbers found for the given criteria
- Percent of total: The percentage of total records found for the given criteria
The Distinct household count measure calculates households by unique last name + unique address.
Like dimensions, measures are found grouped in the Field Picker. Measures are color highlighted to easily distinguish them from dimensions. You may restrict the side bar display to only show measures or search for the measures you commonly use.
Clicking a measure label brings it into the Explore Data table.
Adding a measure to the Data table when no dimensions are included in the Data table will simply display the measure value for your criteria. This will be a simple aggregate value such as the count of records. Measures aggregate or summarize multiple rows in the data into just one value.
Combining measures and dimensions as columns of the Data table will result in a measure aggregate value for each distinct dimension value or combination. For example to create a frequency table of age ranges you’d add the Age Range dimension as a Data table column (click its label) then add the count measure as a measure column in the Data table (click the All Records Count label). After querying, the Data table will display a row for each unique age range in one column and the corresponding record count in a second column.
Understanding Filtering
Both dimensions and measures may be used to add filter criteria. It is more common to filter your criteria using dimension. Some example dimension filter criteria:
- Include only registered voters
- Exclude a given age range
Filtering on Dimensions
A dimension filter removes data from the raw underlying table. These filters are applied on a row-by-row basis by simply checking whether that row’s value for the dimension meets or does not meet the filter criteria.
Run: Refresh query results
Any time you make changes to the Explore the Run button will be enabled. Click the Run button to execute the generated query and update your Data Table with refreshed data.
Sorting Data
The Explore Data table may be sorted. Click a dimension or measure column header label to sort results from highest to lowest. Clicking again will sort from lowest to highest. You can sort multiple columns by holding down the Shift key, then clicking on the column headers in the order you’d like them sorted.
Note that if you reach a row limit, you will not be able to sort row totals or table calculations.
Pivoting Dimensions
Multiple dimensions are often easier to look at when you pivot one of the dimensions horizontally. Each value in the dimension will become a column in the Data table. This makes the information easier to consume visually, and reduces the need to scroll down to find data. Up to 200 pivoted values are supported.
To pivot a dimension, click Pivot for that dimension. Before running the query, be sure that you also have included at least one unpivoted dimension and at least one measure. You can pivot additional dimensions as desired, but must always include at least one unpivoted dimension.
Reordering Columns
You can reorder columns in the Data section by clicking on a column header and moving the column to its desired position. The Explore’s visualization will reflect the new column order after you click Run.
Columns are organized in the Data section by field type: dimensions, dimension table calculations, measures, measure table calculations, and row totals. Columns can be reordered within each field type but cannot be moved out of their field type section. For example, dimension table calculations can be rearranged among themselves, but you cannot place a dimension table calculation in between two measures.
Columns under a pivoted dimension can be reordered, but the order of pivoted dimensions can only be changed by changing the sort order, not by manual reordering.
Removing Fields
You can remove a field from your Explore by clicking the selected field in the field picker or by choosing Remove from the column’s gear menu.
You can also remove all fields in an Explore using the keyboard shortcuts Command-K (Mac) or Ctrl+K (Windows).
Once you have removed fields, click Run to get the new query results.
Removing all fields & filters
To reset the Data and Filter sections completely, click the Gear icon to the right of the Run button then click Remove Fields & Filters.
Displaying Totals
Sometimes a summary of your data is useful. You can add column totals to your report by clicking the Totals checkbox in the upper right of the Data display table, then running the report.
You can also add row totals to your report, but only if you’ve added a pivot to your report.
If you’ve added row totals, and your query exceeds any row limit that you’ve set, you will not be able to sort the row totals column (though you can sort dimension and measure columns as normal). This is because you might be missing rows in your data that should be included in your totals. If you run into this issue, you can try increasing your row limit (up to 5,000 rows).
There are some cases when totals won’t be available:
- Totals are only available for measures, not dimensions.
- Certain types of columns won’t total, due to database limitations, or because the value would not make sense as a total.
Additionally, there are some things to keep in mind about how totals work in certain situations:
- Columns that count unique items might not add up as you expect, since the same item might show up in several categories, but only be counted as one unique item in the totals.
- Some table calculations that perform aggregations, such as calculations using percentile or median, might not add up as you expect. This is because table calculations calculate totals using the values in the total row, not using the values in the data column.
- If you’ve filtered your report by a measure, totals may appear to be too high. However, in actuality, what you’re seeing is a total for your data before the measure filter is applied. In other words, the measure filter may be hiding some data from your report, even though that data is included in the total.
- Similarly, if you’ve placed row or column limits on your report, and your report exceeds that limit, totals may also appear to be too high. However, what you’re seeing is a total for your data before the limits are applied. In other words, the limits may be hiding some data from your report, even though that data is included in the total.